Customer Success leaders don’t have to rely on gut feel or buy expensive predictive analytics software to develop customer health indicators. As an interim step, statistical regression analysis can identify a short list of predictors, increasing accuracy while avoiding significant time and cost.
Data-driven middle ground
Executives typically construct customer health scores to help their teams focus their efforts. Health scores make Customer Success Managers (CSMs) more proactive by focusing on accounts at greatest risk of downgrading or defection. But significant health score errors can mean CSMs spend their time fixing non-issues while ignoring accounts in real trouble, so predictive accuracy becomes the Holy Grail.
Customer Success teams tend to use “gut feel” to assign red, yellow or green status codes, particularly when available data are few. This method, of course, is subjective and limited by the CSM’s account knowledge and individual interpretation. Most leaders seek more objective and automated metrics, especially when the account volume is high and the time CSMs spend on each is low.
Many turn to tech for help. Customer Success software firms offer exotic machine learning platforms designed to mine various data sources and robotically calculate customer health scores. It’s appealing to have computers do all the work, especially when algorithms can continually adapt and improve their predictive accuracy over time. Most initiatives, however, get bogged down as vendors grapple with metrics selection, data hygiene, and system integration challenges. As a result, progress usually grinds to a halt while implementation costs skyrocket.
An interim approach can bridge the gap. If leaders manually collect relevant data and then use traditional statistical regression techniques, they can develop reasonably accurate, data-driven health scores. If more automation and predictive power are needed in the future, execs will have much of the necessary work done in advance, making deployment of such systems faster and less expensive.
X’s, Y’s, Z’s and errors
Let’s look at defining health scores from a process perspective. As shown in the figure, all processes convert inputs into outputs, and the Customer Experience (CX) is no exception. For example, a SaaS customer seeks a software product to solve a problem (input), and after buying and using it as well as interacting with the vendor (process), the customer decides whether to renew their contract, buy more or fewer licenses, or refer others (output). Each successive customer journey is a little different from the last, so probability theory characterizes the cycle-by-cycle outcomes. Churn rate, for example, is the likelihood that a given account will cancel their subscription based upon the historical behavior observed from a large set of customers.
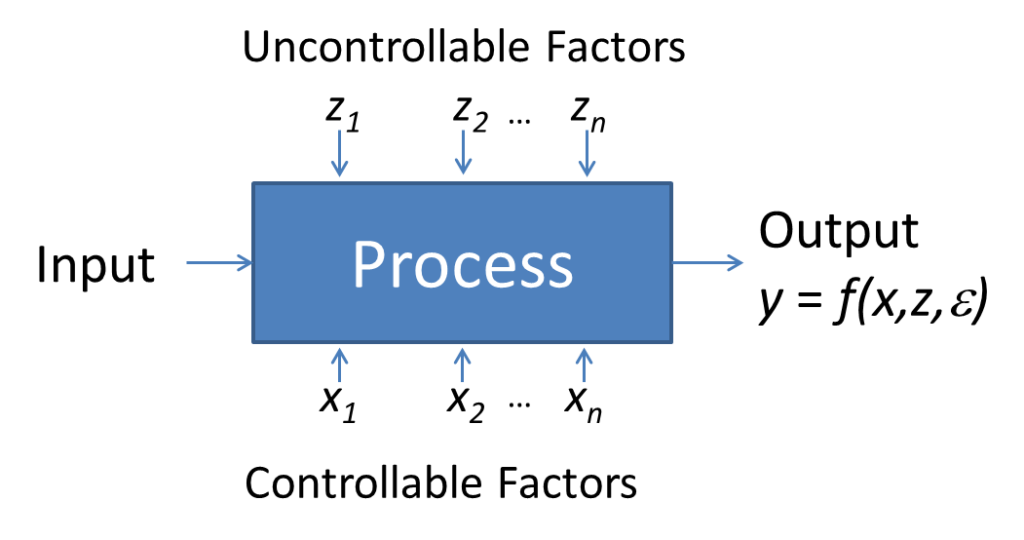
The expected output (y) of any process can be mathematically described, or modeled, as an equation comprised of controllable (x), uncontrollable (z), and random (ε) factors. Variables which can be adjusted or significantly influenced are controllable, whereas factors over which an organization has no involvement are uncontrollable.
Regarding z and ε, analysts should minimize nuisance effects by “blocking” the data, in other words, ensuring extraneous factors occur uniformly so they can be “averaged out” from many observations. If such accommodations can’t be made, analysts should measure the uncontrollable factors separately and include them in the analysis.
The general model when y is continuous and depends on multiple, independent, continuous x variables is:
![]()
Where β0 is the y-intercept,β1 to βn are the coefficients of the factors x1 through xn, and ε is the random error. This linear equation defines the expected value of y based on multiple x predictors. It can also be used to calculate a customer health score.
An example
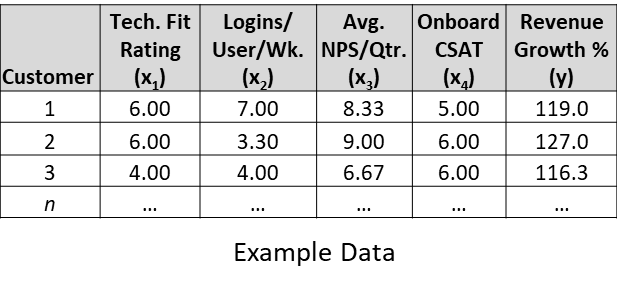
Let’s say we’re interested in knowing why some retained accounts added software licenses while others reduced them during the first year of subscription. The output (y) is calculated by dividing the renewed vs. the original contract revenue and multiplying by 100. We believe it has something to do with these factors (x):
- Technical fit—the degree to which the sold solution matches the customer’s needs; an appraisal by professional services consultants using a scale of 1-7 where 7=perfect and 1=terrible
- Logins—the average usage per person per month; measured automatically by the software itself
- NPS—overall customer satisfaction; measured quarterly by survey software and calculated as an average by account
- Onboarding Customer Satisfaction (CSAT)—overall happiness learning and using the new software and achieving desired outcomes after the initial phase; rated on a 7-point scale (1=very dissatisfied to 7=very satisfied) by the account “champion”
Let’s say we’d like to use these in our customer health score, but we don’t know how to weight each factor. We select multiple regression analysis, a technique available in a number of statistical software packages. In this case we’ll use the Data Analysis plug-in for Microsoft Excel and examine the results:
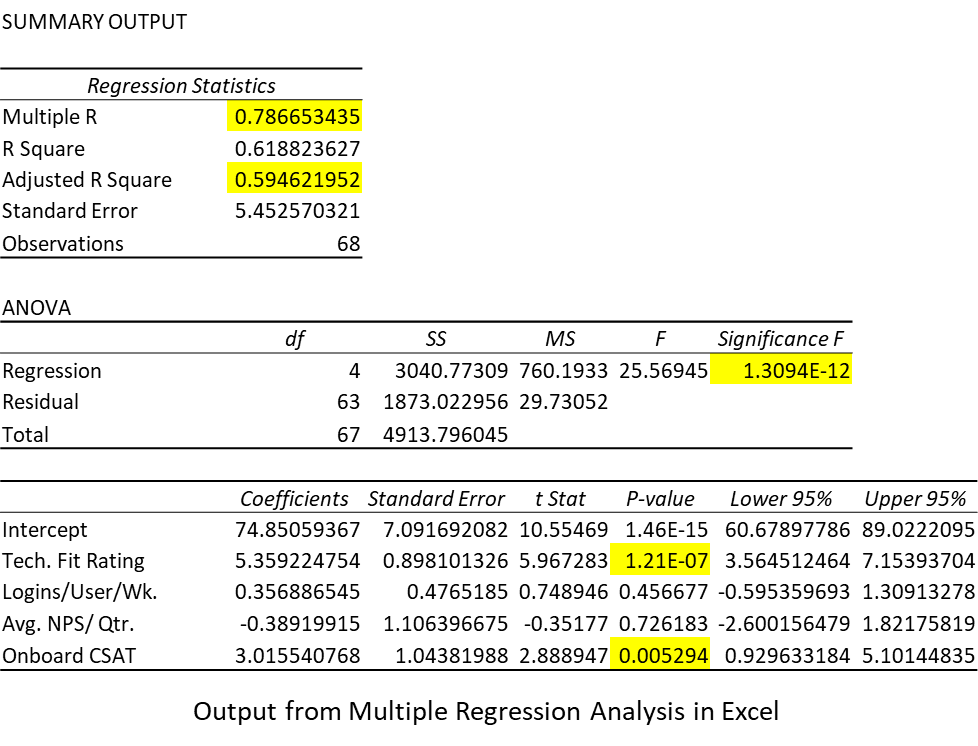
- Multiple R—correlation coefficient describing the strength of the relationship of the predictors (x) with the response variable (y). Anything over 0.7 is considered strong.
- Adjusted R Square—also called the coefficient of determination, this shows the change in y that can be “explained” by the predictors x, in this case, approximately 59%. We use the “adjusted” R square calculation to accommodate for multiple degrees of freedom in multiple regression.
- Significance of the Regression Line—multiple regression analysis uses ANOVA (analysis of variance) to determine how well the equation reflects a valid relationship and is not based on chance. In this case, the value is much smaller than 0.05, or at least 95% certainty of rejecting randomness, so we can be confident in the model.
- Table of Coefficients—these are the β values for the y-intercept and each of the factors. Notice that the statistical significance (p) of the Technical Fit Rating and Onboarding CSAT are the only factors with values less than 0.05. That means Logins and NPS really don’t matter in the result and can be neglected.
Knowing the coefficients we can now write a simple equation that predicts a majority of the account revenue growth based on Technical Fit and Onboarding alone:
![]()
This describes a plane in 3-dimensional space, and the relative weighting of the factors is the ratio of their coefficients, or about 5.4:3. We can create a table that illustrates this relationship by substituting the Technical Fit and Onboarding CSAT values into the equation. If our goal is to grow our retained accounts by at least 10% per year and avoid gross revenue churn (renewal revenue less than 100% of the previous contract), we can then color-code the table to generate a health score from the two variables:
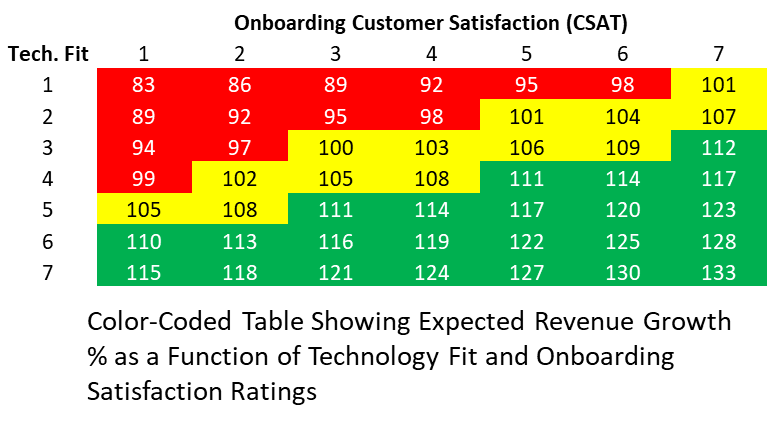
In this particular example, the analysis would underscore the importance of selling to the right customers and ensuring a successful and satisfactory onboarding experience. Armed with this information, the Customer Success leader could make a strong case to Sales on the impact of effective deal qualification. She would also focus intently on improving the onboarding to ensure her own team does its part to maximize results.
Keep in mind that this example predicts only about 60% of the revenue growth. The manager would conclude that there’s more work ahead. She would formulate hypotheses about which other factors, both controllable (x’s) and uncontrollable (z’s), could be meaningful. These could include things like product satisfaction, open help desk tickets, CSM skills for uncovering opportunities, the earned level of trust, or the customer’s readiness for change. Some metrics may be readily available while others may be new and must first be deployed. This example shows the need for an iterative approach to customer health score computation.
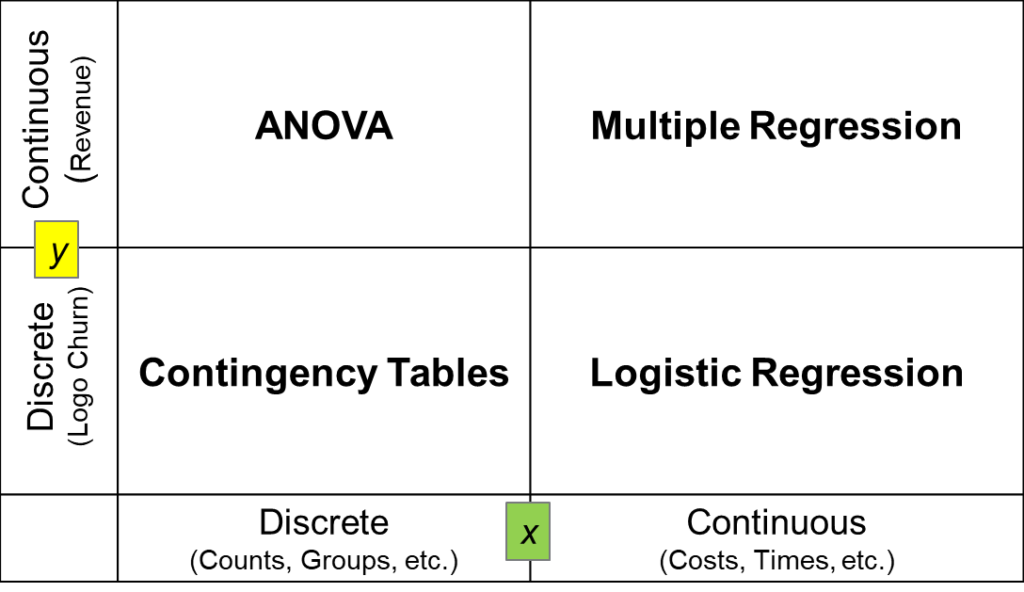
We used multiple regression analysis for this case, but other techniques would be used in other situations. As shown in the table below, had the x’s been discrete or categorical variables (encoding a particular class of support, market segment, CSM, etc.) the right tool would have been ANOVA. If the health scorecard were based on logo churn, contingency tables or logistic regression would have been the correct techniques, depending on whether the factors were continuous or discrete. If there is a mix of both discrete and continuous factors, the generalized linear model can be used to determine coefficients for discrete or continuous dependent variables.
There’s a middle ground between customer health scores based on intuition and those requiring expensive predictive analytics technology. It’s possible to generate data-driven health scores using traditional statistical regression techniques, either with the help an internal data scientist or with an outside consultant. It’s a far better solution than guessing in the short term.