This time of year many of us managers use numbers when we conduct performance evaluations. Most of us, however, make serious attribution errors, believing business outcomes are due to individual performances. As a result, we use metrics inappropriately and demotivate our employees. In truth, individual skills are only one factor that produces results.
Mistaken meritocracy
Managers commonly collect statistics on employees, such as in this e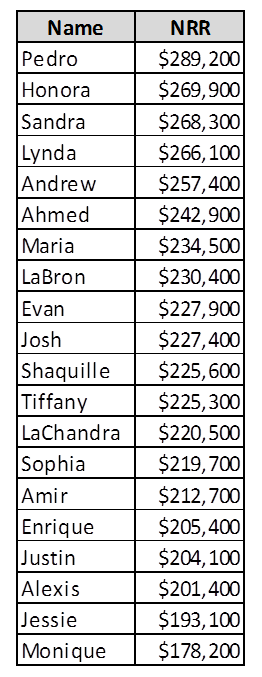 xample recording the Net Recurring Revenue (NRR) by Customer Success Manager at a SaaS company. The manager sorts the numbers from top to bottom and evaluates employee performance based on the numbers. In this case, clearly Pedro and Honora are the rock stars—representing the top 10%—whereas Jesse and Monique are struggling. The decision is simple: pay fat raises to the top performers and fire those who can’t keep up.
A histogram of the data shows it follows the shape of the standard normal (bell curve) distribution. During our formative years, teachers conditioned us to believe that students at the top of the bell curve were the smartest while those at the bottom were the abject failures. It’s no wonder we tend to perpetuate this view when we manage subordinates.
In the eyes of a statistician, however, the bell curve means something entirely different. Work occurs as a process, and processes naturally vary. People accomplish work by converting inputs into outputs with the aid of methods, raw materials, equipment and information. Environmental and customer factors also come into play. While we expect consistency, results always differ from cycle to cycle. Why? Certainly the people performing the work don’t do it in exactly the same way every time. But variations occur in all the other factors, too.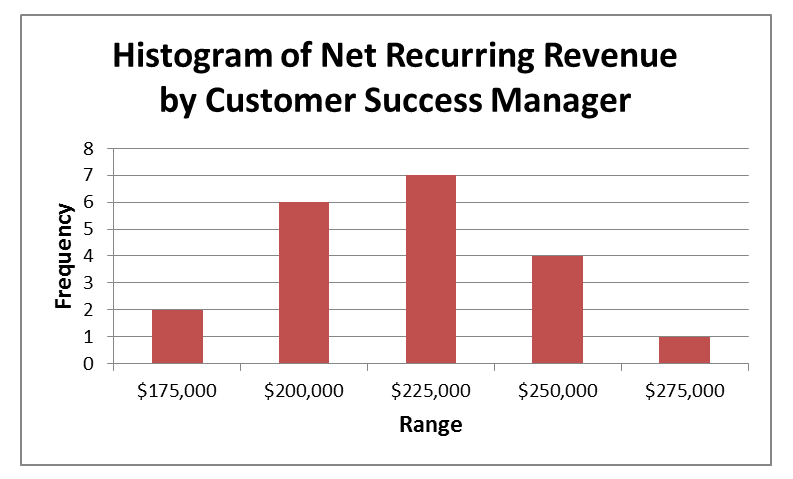
In the example above, Net Recurring Revenue clearly differs by CSM. Individual knowledge and skills matter, but so do other aspects: fit between the customer need and the solution, extensiveness of product adoption, changes to features, and even nature of interpersonal relationships. In our stochastic world, process factors always fluctuate and interact, thereby altering the outcomes. While we may jump to the conclusion that certain employees deserve praise or blame, this standard normal distribution indicates the observed variation is random. Although results cluster in a somewhat predictable pattern, there’s no single attributable cause for any individual result. Consequently, how a CSM is ranked mathematically is more a matter of chance than a reflection of the employee’s ability.
Not everyone is Michael Jordan
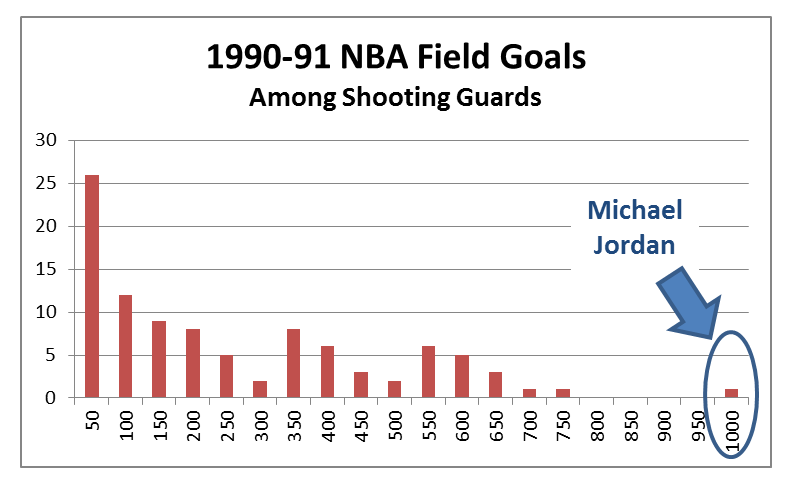
That’s not to say there can’t be significant skill differences between individuals. For example, Michael Jordan is widely considered one of the greatest basketball players of all time. His numbers stand out quite starkly from all the rest. This histogram shows NBA two-point shots made by shooting guards during the 1990-91 season. All players fall somewhere on the distribution, save one on the very extreme—Jordan—whose 990 field goals dwarf all others. Individuals with exceptionally rare talent stick out like a sore thumb, and just like Michael Jordan, you can’t pay them enough in accolades or money.
 Under normal circumstances, the contributions of any single individual are much less than we might expect. In a study I conducted some years ago on call center agent performance, we discovered that despite a well-intended “pay for performance” program intended to motivate behaviors, differences in agent skills impacted call handle times or call quality scores only about 6% of the time. The most influential factors fell well outside the control of the agents: the wide range of needs handled, inconsistent company policies, regular technology snafus and chronic information gaps.
Improve process; lead people
Metrics characterize the process, not the people. In fact, without using advanced statistical methods, the contributions of any one factor, a person or otherwise, cannot be reliably determined. So unless we managers have a Michael Jordan on the team, our best course of action is summed up by quality guru W. Edwards Deming:
“Figures on performance should be used not to rank the people in a group that a fall within the system, but to assist the leader to accomplish improvement of the system.”[1]
The typical carrot and stick approach to management only goes so far. When we reward or punish employees based on random mathematical outcomes, our workers become demoralized, fearful and competitive, leading to lower team morale and performance.
Alternatively, much more can be gained through continuous process improvement. When we carefully study cause-and-effect relationships and make positive changes on how the work itself gets done, we raise performance for everyone, across the board. And when we engage our employees in the ongoing improvement effort, teamwork blossoms and results relentlessly improve.
Did you enjoy this article? Subscribe to Excel-lens now and never miss another post.
Source:
[1] Deming, W. E. (1982). Out of the Crisis, Massachusetts Institute of Technology Center for Advanced Engineering Study, Cambridge, Mass. pp. 118